Plot the discrete values in a numeric series within a specified interval.
Arguments
- x
Numeric series (
numericvector or object of class"discretes").- from, to
Numeric values defining the range to plot; single numerics.
- ...
Additional arguments passed to the underlying
plot()function.- closeness
Numeric value indicating how close to the (non-infinite) sinks the points should no longer be plotted. This is because there are an infinite number of points around each sink.
- tol
Passed to
dsct_keep()when subsetting the series betweenfromandto.
Details
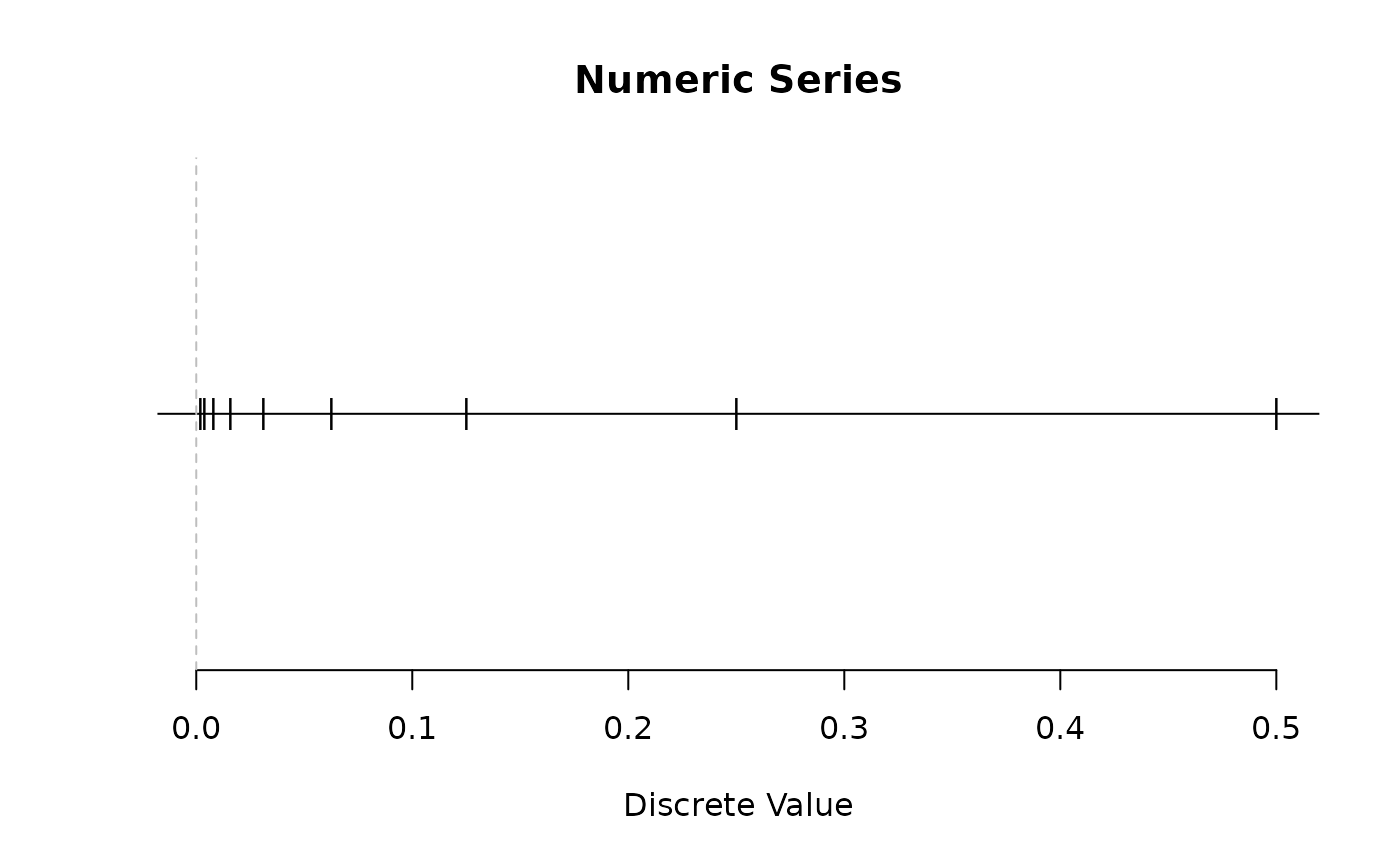
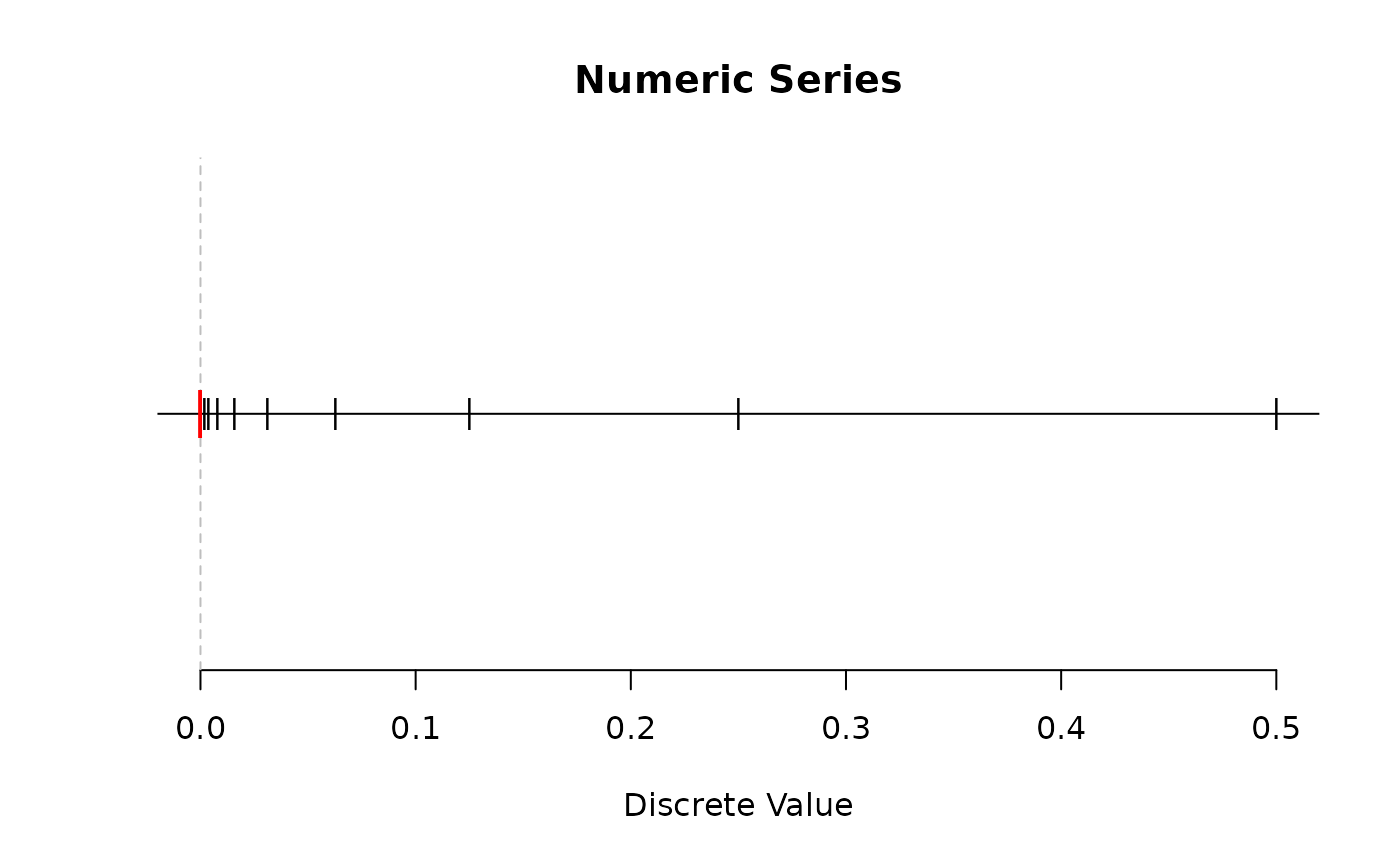
Sinks at finite values are indicated by vertical dotted gray lines. A red tick mark is used to indicate that a finite sink value is part of the series.
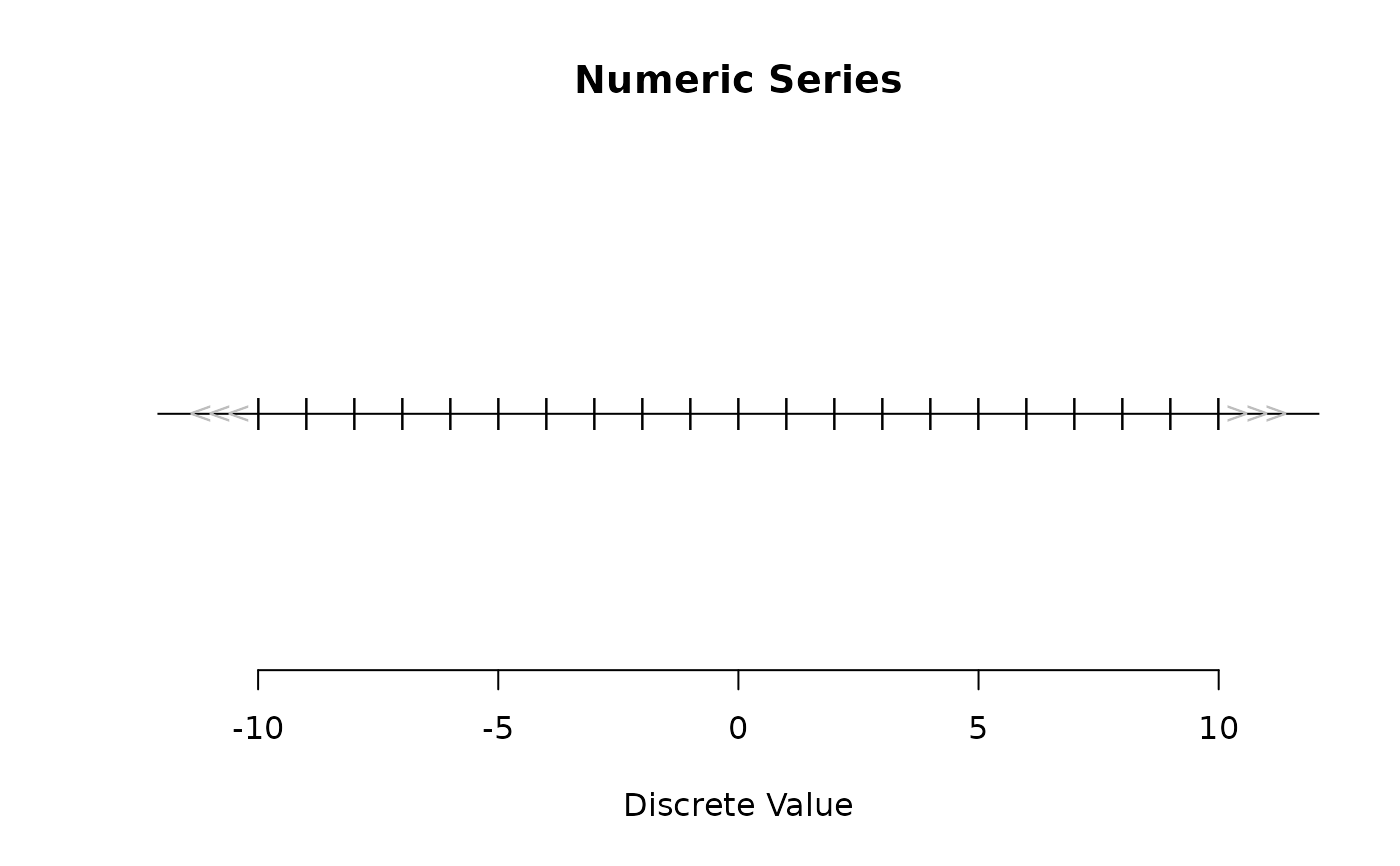
When the series extends to infinity in either direction, three arrows
(< or >) are drawn to indicate this. When infinity is part of the series,
the last arrow is red.
This is a simple plotting scheme with naive handling of infinite discrete values:
The
closenessparameter does not adjust with the scale of the data, so may require tuning more often by the user.When the series extends to infinity (in either direction), an arbitrary cutoff of 10 units beyond the last finite sink or
representative()value (whichever is closer to the infinite sink) is used. This can be manually adjusted by changing thefromandtoparameters.
Note
If this function takes a long time to plot, it's likely because
your series has
slowly varying
behaviour next to a sink,
like 1 / natural1(), where discrete values pile up rapidly
while approaching the sink very slowly. To avoid so many points from
being plotted, increase the closeness argument.